Financial Inclusion: Blurred Lines, Sharper Vision
It is amazing how one concept—financial services for the poor—can mean so many different things to people. Most agree that it is somehow broader than microfinance, though pinpointing its contours remains elusive.
What’s most telling and interesting is how national governments themselves view financial inclusion. One of most direct ways to learn about governments’ vision of financial inclusion is to study how they measure inclusion. After all, robust measurement efforts are all about strict categorizations, clear definitions, and standard calculations.
A More Complex Financial Landscape, An Evolving Data Architecture
The newly released, Financial Access 2012: Getting to a More Comprehensive Picture, is quite telling on this front. Based on eight years of data (2004-2011) from the International Monetary Fund’s (IMF) Financial Access Survey (FAS), it reflects how regulators are expanding their data collection efforts, beginning with data on the deposit-taking regulated institutions they oversee (commercial banks for example) to also starting to include data from other financial service providers (non-bank financial institutions for example). Governments, in contrast to some funders, have always systematically reported both deposit and credit information. And though the coverage is still far from complete, FAS shows increased interest and data collection on insurance. Regulators are also keenly following how delivery models are changing and capture data on automatic tell machines (ATMS) alongside that of branches. Finally, as it is increasingly recognized that small and medium enterprises (SMEs), not only households, need access to finance for managing cash flows, funding investments, and insuring against risk, regulators are also starting to improve data collection on this front.
Ask, and Eventually You Shall Receive
The expanded scope of FAS, an annual regulators’ survey that covered 187 jurisdictions in 2012, is the most comprehensive source of global supply-side data across countries and over time. And it is one of the endorsed sources for the G20 Basic Set of Financial Inclusion Indicators.
However, data availability varies greatly. Commercial bank data is, not surprisingly, of the highest quality by far while SME data tends to be quite patchy (2011 was the first time the FAS questionnaire included data on SMEs). But this news is far from dire. There is a virtuous circle in data collection – with the repeated requests for (smart) data, availability and quality improves over time. There is an inherent sustainability in the FAS questionnaire in that all answers come from the regulators themselves. Once a data point is accepted at the country level it is likely that collection will continue nationally, whether or not it is then consolidated at the global level.
So What Are the Data Telling Us?
For all the details, you’ll have to read the full report. Better yet, you can explore the FAS data yourself by on the IMF’s website. But here are some data highlights:
- Both deposit and loan penetration growth rates—measured by the growth in the number of accounts or accountholders of deposit/loan per 1,000 adults—slowed considerably in 2008 and started to pick up after the financial crisis. (see Figure 1)
- High income countries have over 10 times the deposit penetration as low income countries, and lower middle income countries have three times the deposit penetration of low income countries
- Deposit-taking non-bank financial institutions’ loan penetration increased relative to that of commercial banks everywhere in the world, with the exception of high-income countries
- The number of commercial bank branches and ATMs increased steadily during 2004–2011, however there is still a large gap between lower-income and upper-middle-and high-income countries: Low-income countries had 3.2 ATMs and 3.8 branches per 100,000 adults in 2011, while high-income countries had 123 ATMS and 34 branches per 100,000 adults.
- The number of insurance policies has more than doubled since 2004; life insurance is the dominant service provided.
- Higher-income countries tend ot have more developed SME finance markets than that of developing countries as measured by ratios of SME loan volume-to-GDP and SME loan accounts-to-total firm loans.
Figure 1: Percentage Change in Commercial Bank Deposit and Loan Accounts (annual medians)
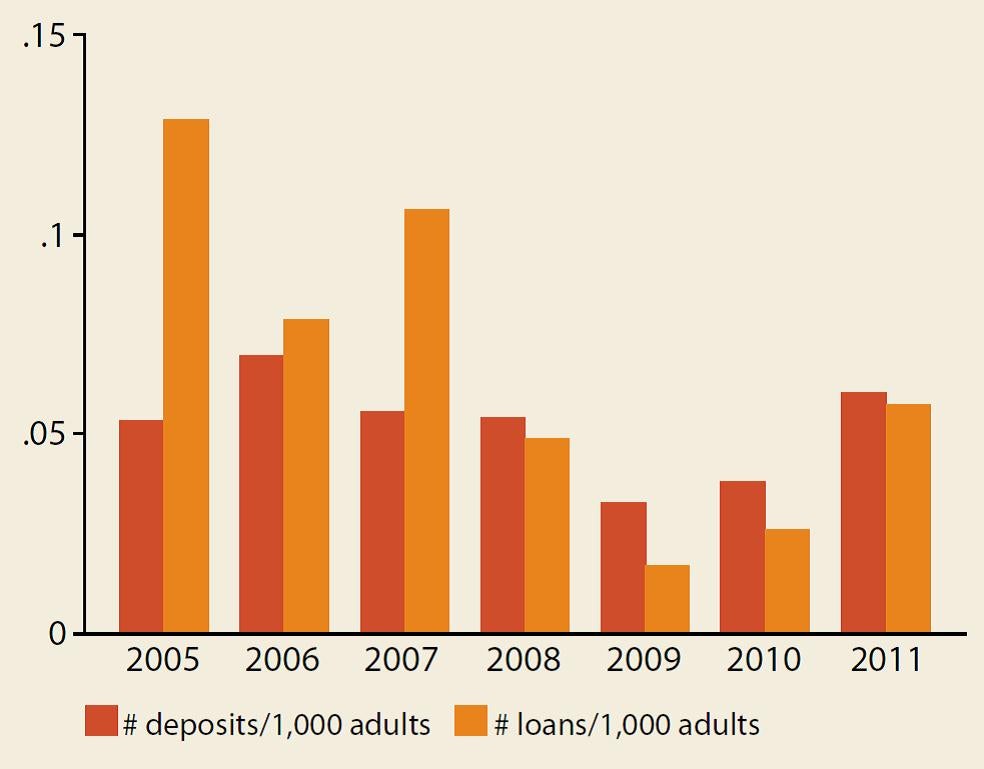
Data Source: FAS (IMF)
In the full report you will also find an analysis of the complementary relationship between demand-and supply-side data using FAS and the Global Findex: the two surveys generally tell similar stories of financial inclusion. The final chapter of Financial Access 2012 includes an exploration of the links between financial inclusion and financial sector and macroeconomic variables. Although such analyses are works in progress, some interesting results have emerged: higher financial inclusion (measured by deposit penetration) is associated with higher income levels and less inequality, though a certain degree of financial access and usage and financial sector depth is required before the inequality improves (see Figure 2).
Figure 2: Financial Inclusion and Inequality
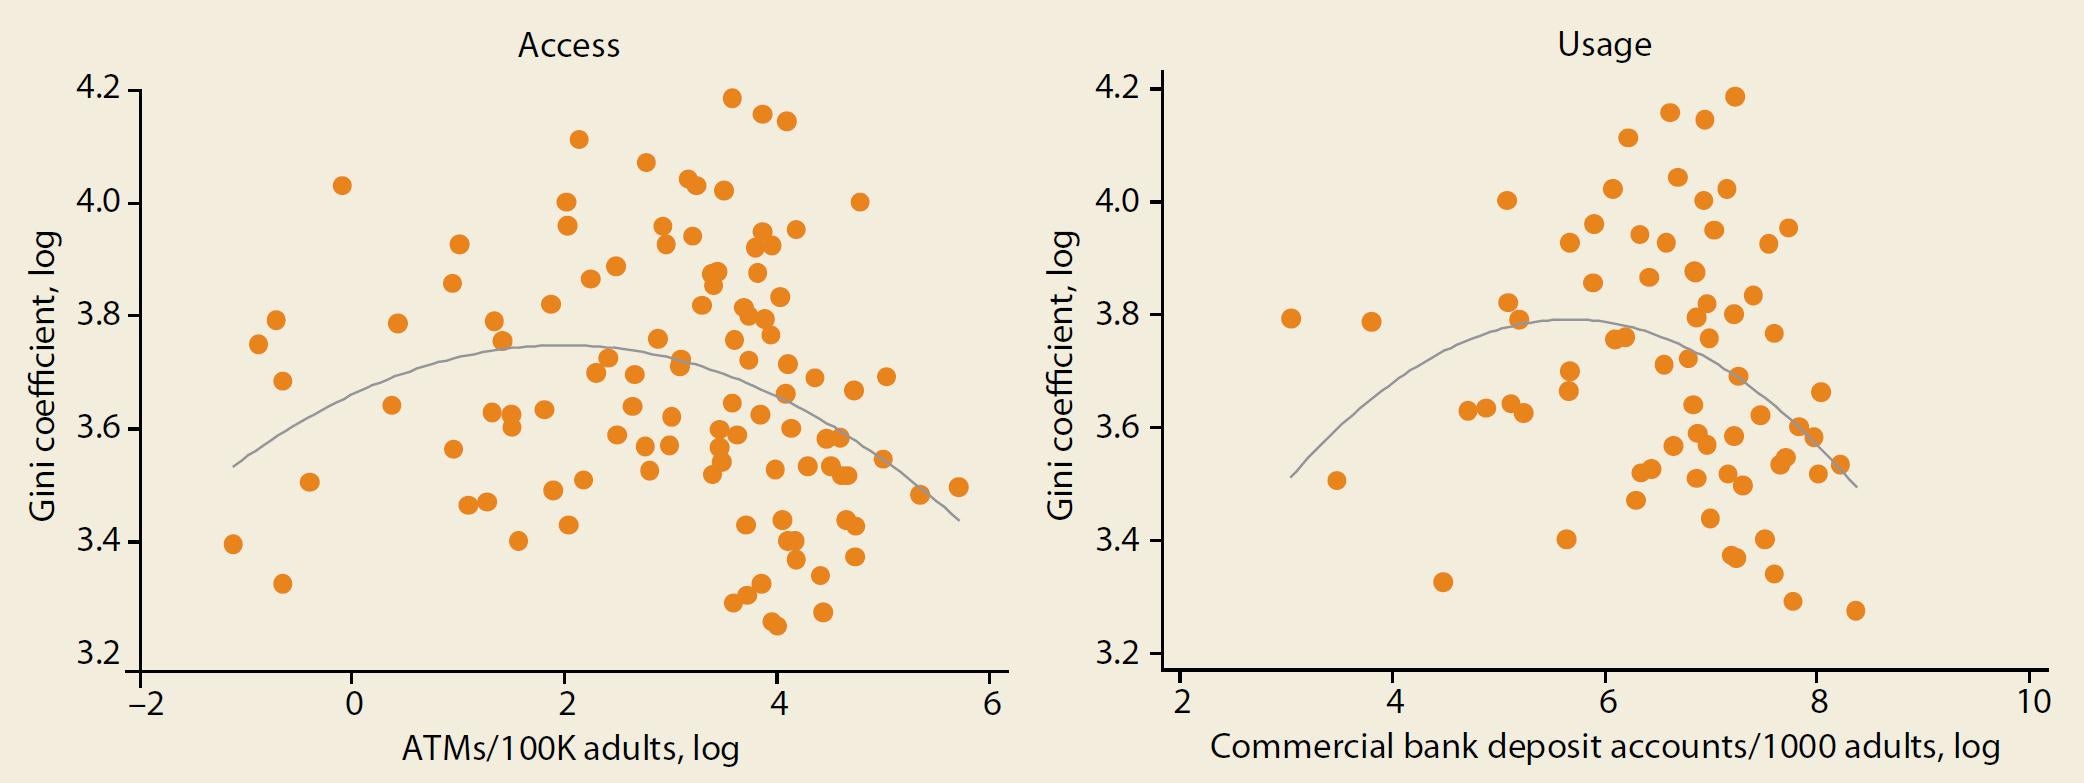
Data Source: World Development Indicators (World Bank), FAS (IMF)
National governments are embracing the increasingly broad range of providers that offer financial services for the poor. Previously specialized pro-poor financial institutions are transforming into commercial banks, and local commercial banks are showing new interest in reaching low income populations. We received feedback during the survey implementation that the term “microfinance institution” no longer necessarily meant much in some markets as a range of institutions of different legal statuses are now serving the base of the pyramid. The lines are definitely blurring. Most importantly, as national governments take on ambitious visions of financial inclusion that includes all financial services for households and enterprises provided by an ecosystem of providers, their broader view of the market that serves poor people will help improve policy design.
Alexia Latortue is CGAP’s Deputy CEO and manages the clients and products workstream. She is a co-author of the report. Oya Ardic is an Operations Officer at IFC Access to Finance Advisory and a co-author of the report. CGAP and the IFC collaborated with the IMF’s Statistics Department in 2012 to conduct the expanded FAS.


Add new comment