Financial Inclusion: Is the Glass Half Empty or Half Full? (Pt 2)
As I stated in my previous blog on the debate over the latest Findex, we continue to make important progress toward the goal of universal financial access. Progress is uneven and the timeline uncertain, but we have a pretty clear idea of what to do. Unfortunately, the picture is less clear on the important question of usage, and CFI is right to raise high dormancy rates as a concern in its report, “Financial Inclusion: Hype vs Reality.” As with the access data, however, disaggregating the figures on account usage reveals differences across countries that offer more encouraging signals than the aggregated figures, albeit with one very important caveat.

Findex shows we still have a lot of work to do on usage: 25 percent of account holders in the developing world haven’t used their accounts for a single deposit or withdrawal in the past year (as shorthand, I will refer to these as dormant accounts). Part of the challenge in the Findex data, however, is that backsliding or slow progress in a few big markets is drowning out progress in the rest of the world. The primary reason is India, which is skewing the account dormancy figures significantly because of its large population and extraordinarily high levels of inactivity — at 48 percent of account holders in 2017. If we take India out of the equation, the percentage of inactive account holders in the developing world comes down from 25 to 16 percent.
If, however, we look at the change in dormancy rates for individual countries, rather than the aggregate, a more nuanced picture emerges. Findex collected data on dormant account holders for 87 low- and middle-income countries in 2014 and 2017. Of these countries, 46 saw their dormancy rates go down by an unweighted average of 14 percentage points, 12 saw their dormancy rates go up by an average of 10 percentage points, and 29 had no discernable change (as the difference was within the 3.5 percent margin of error in either direction).

But here’s where the caveat comes in. Findex’s dormancy and usage numbers are not quite what they seem. To ensure greater accuracy in capturing mobile money accounts, respondents are not asked if they have a mobile money account; they are asked if they have used a mobile money account in the past year. In other words, Findex counts only active mobile money accounts. For financial institution accounts, respondents are asked if they have an account and then whether they have used it in the past year, so a clear distinction can be made between active and inactive accounts (see the Findex glossary for details). The net effect is to understate the number of account holders added in Sub-Saharan Africa and to overstate the activity rates for these accounts.
Given the prevalence of mobile money in Sub-Saharan Africa, this has a significant impact on Findex’s activity rates for the region. A back-of-the-envelope exercise using GSMA’s supply-side data (which correlate closely with those of Findex), helps illuminate the degree to which this affects Africa’s dormancy data. According to GSMA, there were 338 million registered mobile money accounts in Sub-Saharan Africa in 2017. If we add these accounts to the 195 million financial institution accounts from Findex, we can infer that there are roughly 533 million registered accounts in the region (the number of account holders will be lower because of people holding both mobile money and financial institution accounts, which Findex accounts for). This means that roughly 232 million accounts have been added since the last Findex, not the 72 million that you would get from doing the math with the Findex data.
That’s potentially good news, but with this increase in number of accounts comes an increase in the overall inactivity rate in Africa. Roughly 64 percent (216 million) of the mobile money accounts reported by GSMA were considered inactive. If we combine the GSMA and Findex data on inactivity, the 2017 dormancy rate in Sub-Saharan Africa shifts from 13 percent of account holders (in Findex) to 49 percent of accounts (combining the two data sets). This adjusted dormancy rate is now roughly equivalent to dormancy rates in India and represents a significant increase from the inferred rate in 2014 of 41 percent (again, based on accounts, not account holders). This adds approximately 129 million dormant accounts back into the global total, raising our developing country dormancy rate sharply back in the direction of the 25 percent mark.
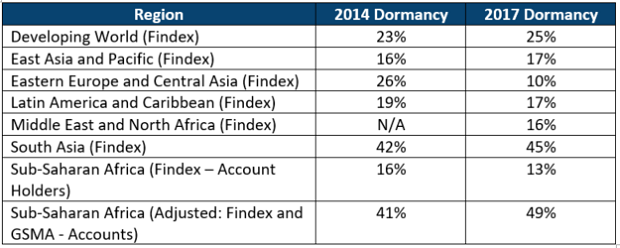
The point of this exercise is not to provide an exact estimate of dormancy rates in Africa, but to demonstrate that we have a pretty serious usage challenge and that it is concentrated in India and Sub-Saharan Africa, where the denominator of new accounts has grown the most. Not coincidentally, they are also the two regions with the highest rates of extreme poverty. India increased access to accounts from 53 to 80 percent of adults from 2014 to 2017, adding 290 million account holders. In Africa, we have inferred that 232 million accounts were added in the same period. If the Africa data are normalized for inactivity, then India and Africa together would account for roughly 77 percent of all people accounts added between 2014 and 2017. But a large portion of them are inactive. It seems intuitive that, with the addition of accounts at this pace, there might be a delay between opening an account and using it, but we will have to wait until the next Findex to properly test this assumption.
CFI is right to point out dormancy as a problem, but it missed a big part of the challenge in its analysis: high dormancy in Sub-Saharan Africa, which barely registers in Findex, and the fact that mobile money accounts are measured differently means it is difficult to compare inactivity rates across regions. But I am not sure this means we should ignore the registered account numbers entirely, as CFI suggests. They are important because they show progress in giving people access to accounts. But activity rates matter, too, and the clear challenge now is to stimulate usage of those accounts in Africa and South Asia. This is a more complex undertaking because it involves behavior changes for new account holders and the testing of different value propositions for providers — and both of these challenges take time to address. But there are hints about how this can be done. GSMA, in its latest State of the Industry Report on Mobile Money, focused on four factors that are closely associated with high activity rates: a robust agent network, enabling mobile money regulation, a digital account-based model and providers serving as integrated platforms for the wider payments ecosystem. It provides the example of MTN in Ghana, where activity rates went from 7 percent in June 2012 to 73 percent in June 2017. Understanding the factors that created the change at MTN in Ghana will provide valuable insights into what it will take to move inactivity rates, which have been stubbornly sticky in the mobile money industry since 2011.
Beyond overall account dormancy, the CFI report raises interesting questions about important use cases that deserve brief examination — savings, credit and payments.
On savings, it is disappointing that the number of survey respondents in developing countries who reported saving in the past year came down from 53 percent in 2014 to 43 percent in 2017. Unfortunately, Findex doesn’t tell us why this might be happening. While customers not perceiving the value of their accounts is one possible explanation, factors like inflation, the availability of alternatives, economic stagnation or other disruptions could be affecting the amount of money people are able to save. What is encouraging is that more of those who did save used a financial institution: this figure grew from 42 percent in 2014 to 47 percent in 2017.
On credit, I am more sanguine for a couple of reasons. First, we can’t draw any real conclusions from the Findex data. For developing countries, the number of respondents who reported borrowing in the previous year dropped from 47 to 44 percent, which is just outside the margin of error for the sample size and not a particularly strong signal. And Findex may or may not capture data on credit provided via mobile money accounts, depending on whether people consider this a loan, so it is potentially missing some digital credit borrowing. But more to the point, credit is a financial product where more isn’t necessarily better. The main constraint to accessing credit shouldn’t be whether someone has an account. It should be whether they can afford it.
Digital payments are the real story in Findex, and it is no surprise that this number is going up. Many accounts in places like India and Africa were established expressly to facilitate payments. In the developing world, the proportion of respondents who reported sending or receiving a digital payment in the past year went from 32 to 44 percent, and this growth was consistent across all markets. It makes sense. Just think about the way you use your bank account: you might save, and you may or may not have a loan for a house or a car, but you almost certainly make regular payments from your account. A mobile or low-value bank account in many ways mimics a current account. It is a store of value from which payments can be sent and received. You don’t expect to get a return on it, but you might use it to help establish a credit rating.
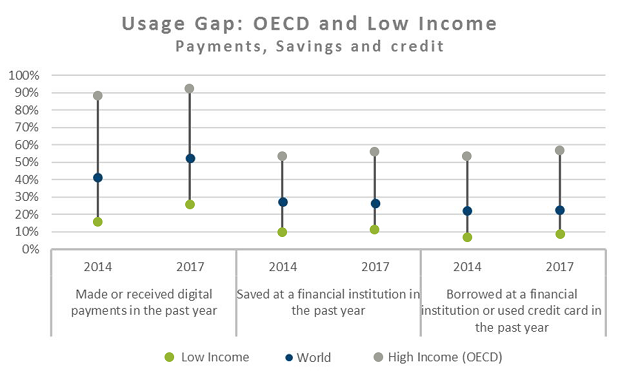
Payments seem to me to be a foundational product, especially for people with very little money, who may not have enough to save consistently and may not be creditworthy. Comparing payments usage in developing countries to high-income OECD countries puts this issue in perspective. In high-income OECD countries, 92 percent of respondents reported making or receiving a digital payment in the past year. The figure for low income countries was only 26 percent, a gap of 66 percentage points. The usage gaps between OECD countries and low-income countries was less pronounced for both savings and credit (45 and 49 percentage points, respectively). This is primarily because credit and savings products were not as widely used in rich countries as payments: only 56 percent of account holders reported saving in a financial institution in the past year, and only 20 percent borrowed from a financial institution (although this rose to 57 percent when credit cards were counted). The concept of “universal usage” is best applied to payments services rather than the other financial services where customers’ needs are more varied.
For me, the jury is still out on usage. We have seen massive growth in accounts in the past three years, but dormancy rates have remained stubbornly steady, particularly in markets with rapid account growth. The trick will now be to activate all of those newly opened accounts, and we will have to wait until the 2020 Findex (and perhaps beyond) to understand whether we are simply dealing with a time lag or whether we have a bigger problem on account usage. What I would expect to see is a gradual improvement in activity rates for accounts in India and Sub-Saharan Africa, and payments will be key to that story. Payments are a gateway use case. Over time, they can create a foundation for other use cases to emerge through improved data on customer activity and by creating trust in formal financial services.
But we should not necessarily expect to see other use cases grow in proportion to payments, not least because it takes time to build data trails and the level of trust required for more habitual use of financial services. Nor should we expect it to happen quickly. Financial inclusion, as opposed to just financial access, is and has always been a long-term endeavor.



Add new comment