Where’s The Cash? The Geography Of Cash Points In Tanzania
The Financial Sector Deepening Trust of Tanzania (FSDT) has completed a census of cash outlets in the country, where basic cash in/cash out transactions can be conducted. The data was collected during April-July 2012, and is freely available to view on Google Maps here. We produced a summary report, available here, which describes the data and the headline results more fully.
The availability of places where one can exchange cash for transferable or storable electronic value is an essential component of financial access. Given the traditional paucity of financial infrastructure in Tanzania, we wanted to see how transformational the new mobile money agents really are. We were particularly keen to see how deeply mobile money agents have gone into rural areas, off paved roads, away from traditional banking infrastructure.
Mobile money agents outnumber all other financial outlets by almost 10 to 1
Figure 1: Spread of cash outlets by type of outlet
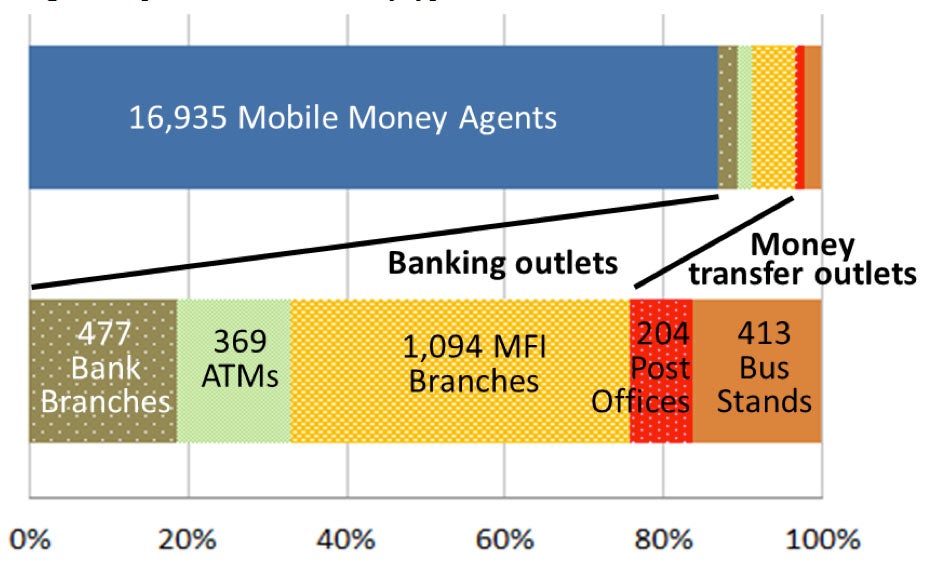
Figure 1 shows the number of cash outlets in Tanzania. M-PESA agents number almost 17,000, and account for 87% of all cash outlets commonly used for financial services or money transfers. (We did not have data on the agents of other mobile money systes.) MFI branches are the second most widely deployed type of outlet, with almost 1,100 points across the territory. Commercial banks have almost 500 branches and an additional 369 stand-alone ATMs (i.e. ATMs outside of branches). Traditional money transfers occur through over 400 bus stands and 200 post offices.
A significant portion of the population is left out
We next looked at the presence of cash outlets by ward. (There are 2,542 wards in Tanzania as defined in the 2012 census). M-PESA agents are present in 29% of wards, accounting for 40% of the population and occupying 19% of the landmass. They are far and away the most present. Bank branches exist only in 7% of wards, which contain 12% of the population. Bank presence increases to 17% of wards and 25% of the population if stand-alone ATMs and MFI branches s are included as well.
Post offices have a similar presence to bank branches (7% of wards, with 11% of the population). Adding inter-regional bus stands only increases the number of wards and share of the population covered with traditional money transfer outlets by an additional 2%.
Population density is an imperfect predictor for mobile money agent coverage
Wards with no M-PESA agents have on average a much lower population density (36 people per square kilometer) than wards with mobile money agents (103). Yet 65% of wards with no agents have a population density higher than the national average. Moreover, 38% of wards with no agents have a population density higher than the average across wards with agents. In fact, there is a surprisingly weak correlation (0.24) between the population density and the number of M-PESA agents across wards. The major cities are not over-represented in the agent count. M-PESA agents in the Dar es Salaam region only account for one quarter of the total. Another 20% of agents are in other urban centers. Almost half of agents (43%) are in areas designated as rural or mixed.
Agents largely follow the paved road network
Figure 2: Map of mobile money agent locations (red dots) and roads (white lines) in Tanzania
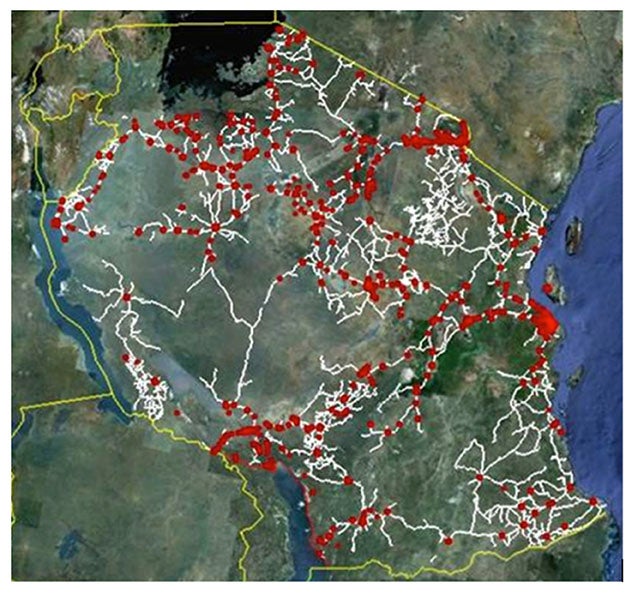
Figure 2 maps the location of M-PESA agents (the red spots) across the national territory. There is a clear bunching of agents, with large swathes of the territory entirely uncovered. This pattern follows the layout of the national road network (the white lines on the map). There is a clear challenge to get the agents off the pavement and deeper into rural communities. The road network layout seems to be a better predictor of the presence of M-PESA agents than population density.
A significant number of agents are far from banks
The reason why agents remain near main roads rather than following population density is probably because banking infrastructure itself follows the roads. Mobile money agents must rebalance their liquidity from time to time, and hence they need to access banking points from time to time. Figure 3 shows how far mobile money agents are from other cash outlets. (Distances are estimated from outlets’ GPS coordinates, with an accuracy of around 50 meters typically, and hence do not reflect actual distance by road, which may be substantially larger.) Each point on a line represents the number of M-PESA agents, out of the total of almost 17,000, which are within x kilometers of the type of outlet designated by that line. 56% of M-PESA agents are within one kilometer of a bank branch, while 83% are within five kilometers.Agent proximity to banking outlets improves to 87% within five kilometers if ATMs are included, and further to 92% if MFI branches are included. Interestingly, the proportion of agents that are within one kilometer of a bank branch is the same within the Dar es Salaam region as for the whole country, so these results are not skewed by the capital.
Figure 3: How close M-PESA outlets are to othe rmobile money agents and banking outlets
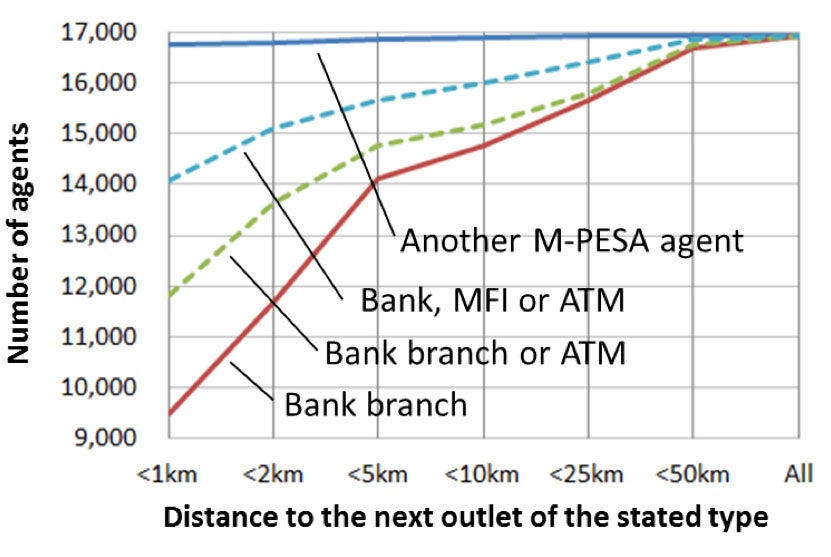
Still, some 1,130 agents are more than ten kilometers away (and 170 are more than 25 kilometers away) from a bank branch or ATM, which would raise rebalancing costs substantially. The graph also shows that 99% of mobile money agents are within about one kilometer of another agent, suggesting substantial agent competition at the local level. In conclusion, despite the seemingly large number of M-PESA agents deployed, large segments of the population are still not within convenient reach of any cash outlet. Agents are indeed largely a ‘last mile’ solution, and are usually not venturing far from where there is banking infrastructure, and that in turn is strung along cities and towns connected by the paved road network. Agents are by and large an extension, but not altogether a substitute for, banking access infrastructure. Mobile money agent deployments are continuing at a fast pace. FSDT is currently undertaking to complete a new survey, and we expect to be able to see significant progress in coverage in the months to come.
Related Blogs
Proximity Matters: Improving the Viability of Frontier Agents
Easy access to agents makes people more likely to use digital financial services, but business as usual has left remote communities underserved. Here are some ways governments and providers are expanding agent networks in hard-to-serve areas.
Can Agro-Dealers Be the Last-Mile Rails for Digital Finance?
New CGAP partnerships test large agribusinesses' potential to bring financial services to millions of rural farmers.
Comments
Thank you - this is a great
Thank you - this is a great piece. It's a very dynamic market. We are working in Iringa District, targeting the rural population. There are few mobile money Agents in our areas - and each bears some considerable risk in holding their cash float and transporting cash to and from the town bank. The Agent and telephone mast network is getting better all the time. Cash handling risks to clients are dropping - transferring them to the Agents.
Love this data...great piece
Love this data...great piece and great mapping. Adopting some of the ideas for the GIS mapping of POS we are updating in Haiti! Low correlation to agents and population density is interesting.
Ignacio and John, allow me to
Ignacio and John, allow me to be a bit philosophical and abstract in my comment. What do we require to increase money thoughts vibration frequency from physical cash to electronic form? As people progress their money forms thoughts, what needs to be done to accelerate the process? How do we, for example inflict into the mind of a person used to cash the sense of security associated with electronic money? At this point in time, if we understand the evolution of thoughts from cash to electronic and what is required, then we can determine if to acclerate electronization or increase cash in/out infrastructure deeper and wider. But should we realize that it could be easy to tweak the excluded's minds to adopt technology, then financial resources are better used in that effort even if it takers a bit longer, than in cashin/out outlets expansion. It took time before calculators were allowed into exam rooms. The understanding then was learners should exercise their minds in mental calculation. But what for if the real world of work would have calculators?. I guess thats why they were allowed in to help do exams better and quicker. If we look at the cost of setting up an Mpesa agent shop and the cost of installing an ATM machine, it looks prudent to invest toward electronic and get ways to have speedy adoption. In the first 5 years Mpesa had made headways. What did Safaricom do to have such a fast adoption? Cash is still prominent but it is more in mobile wallets( not as stores) as a form of transport. So much of Mpesa money is passed on electronically than it is encashed( I suppose).
Add new comment