International Funding for Financial Inclusion: What's New?
Over the past decade, a wider array of funders have become interested in advancing financial inclusion. The entry of new players and mainstream funding sources has resulted in greater need for transparency. Since 2008, CGAP has conducted an annual survey of primary sources of international funding and in partnership with MIX to improve the availability of information on how much funding is supporting financial inclusion, who is funding what and where.
We estimate that in 2013 international funders committed at least $31 billion to support financial inclusion, representing an average growth rate of 7 percent per year between 2011 and 2013.
The analysis is based on data from 56 international funders, which represent 76 percent of the global estimate. The global estimate is calculated on data from this sample as well as publicly available information from Symbiotics MIV Surveys.
The latest set of data reinforces some previous trends – such as the main instrument used and purpose of funding - but also reveals interesting new developments.
Two expected trends
1. Most funding for financial inclusion is delivered in the form of debt
Funders can utilize a variety of funding instruments to support financial inclusion projects. In this year’s data, just as in years past, the majority of funding was in the form of debt ($13.8 billion in 2013). Development finance institutions (DFIs) and multilaterals were the main debt funders with respectively $9.6 billion and $3.6 billion. DFIs’ debt funding was used to finance the growth of financial services providers (FSPs) in Eastern Europe and Central Asia ($4.7 billion) and Latin America and the Caribbean ($1.9 billion). By mandate, multilateral organizations provide loans to developing country governments and the funds are then on-lent to FSPs and/or used to support a broad range of activities toward financial inclusion. Almost half of multilaterals’ debt funding is going to South Asia ($1.7 billion).
2. Most funders focus on addressing supply side barriers
Consistently over the years, international funders have reported to focus their financial inclusion efforts on building financial service providers (FSPs) both in terms of number of projects and in terms of volume of commitments. In 2013, most international funding was used to finance the growth of FSPs ($17.9 billion), and another $1.8 billion went toward building the capacity of FSPs. Although there is an understanding that the root causes of barriers to financial inclusion often relate to the market infrastructure and the policy environment rather than the funding of FSPs, less projects and funding focused on these areas. In 2013, international funders committed $0.6 billion to support the market infrastructure and $0.5 billion to develop enabling policy environments.
Two trends that may surprise you
1. Private funding decreased for the first time; public funding continues to grow
The majority of funding for financial inclusion comes from public sources (DFIs, multilateral and bilateral organizations). In 2013, public funding for financial inclusion represented approximately 75 percent of the global estimate. While many donor country governments have struggled with austerity measures and shrinking budgets, financial inclusion became a priority for the G20 in 2010. Public funders increased their commitments in the past two years by an estimated average of 11 percent each year.
On the other hand, commitments from private funders decreased by an estimated average of 2 percent per year between 2011 and 2013. This is explained by a decrease in private commitments to microfinance investment intermediaries (MIIs), which are the main channel of private funding.
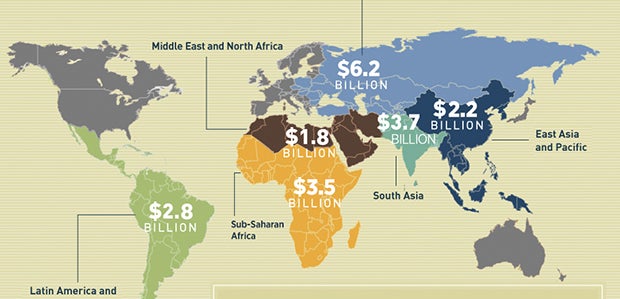
2. Sub-Saharan Africa is among the three regions receiving most commitments, superseding Latin American and the Caribbean
Over the years, international funders have increasingly prioritized Sub-Saharan Africa, and some donors have even begun to focus exclusively on the region. Commitments to this region grew by an average of 11 percent annually in the past two years to reach $3.5 billion in 2013. While Sub-Saharan Africa does not receive the highest amount of funding (Eastern Europe and Central Asia takes that spot), it does have the largest number of active projects (788 out of 3,128 projects in the survey). In addition, when asked about their priority regions for the next five years, funders identified Sub-Saharan Africa and South Asia as the top two areas. In contrast, funding to Latin America and the Caribbean decreased by an average of 2 percent per year between 2011 and 2013, which may represent a shift in international funders’ regional priorities.
It also raises important questions regarding the role of funders. For example, with such a strong focus on the supply side, are funders incentivizing innovation and encouraging providers to become customer-centric? Can the shift in regional priorities be partially explained by the availability of local funding sources? Is the financing of FSPs done in a way that encourages the development of local funding markets? Are funders’ projects addressing the root causes of barriers to financial inclusion to ensure long-term growth and access?
These are a few of the questions we will continue to think about, and we invite you to share your thoughts.


Add new comment