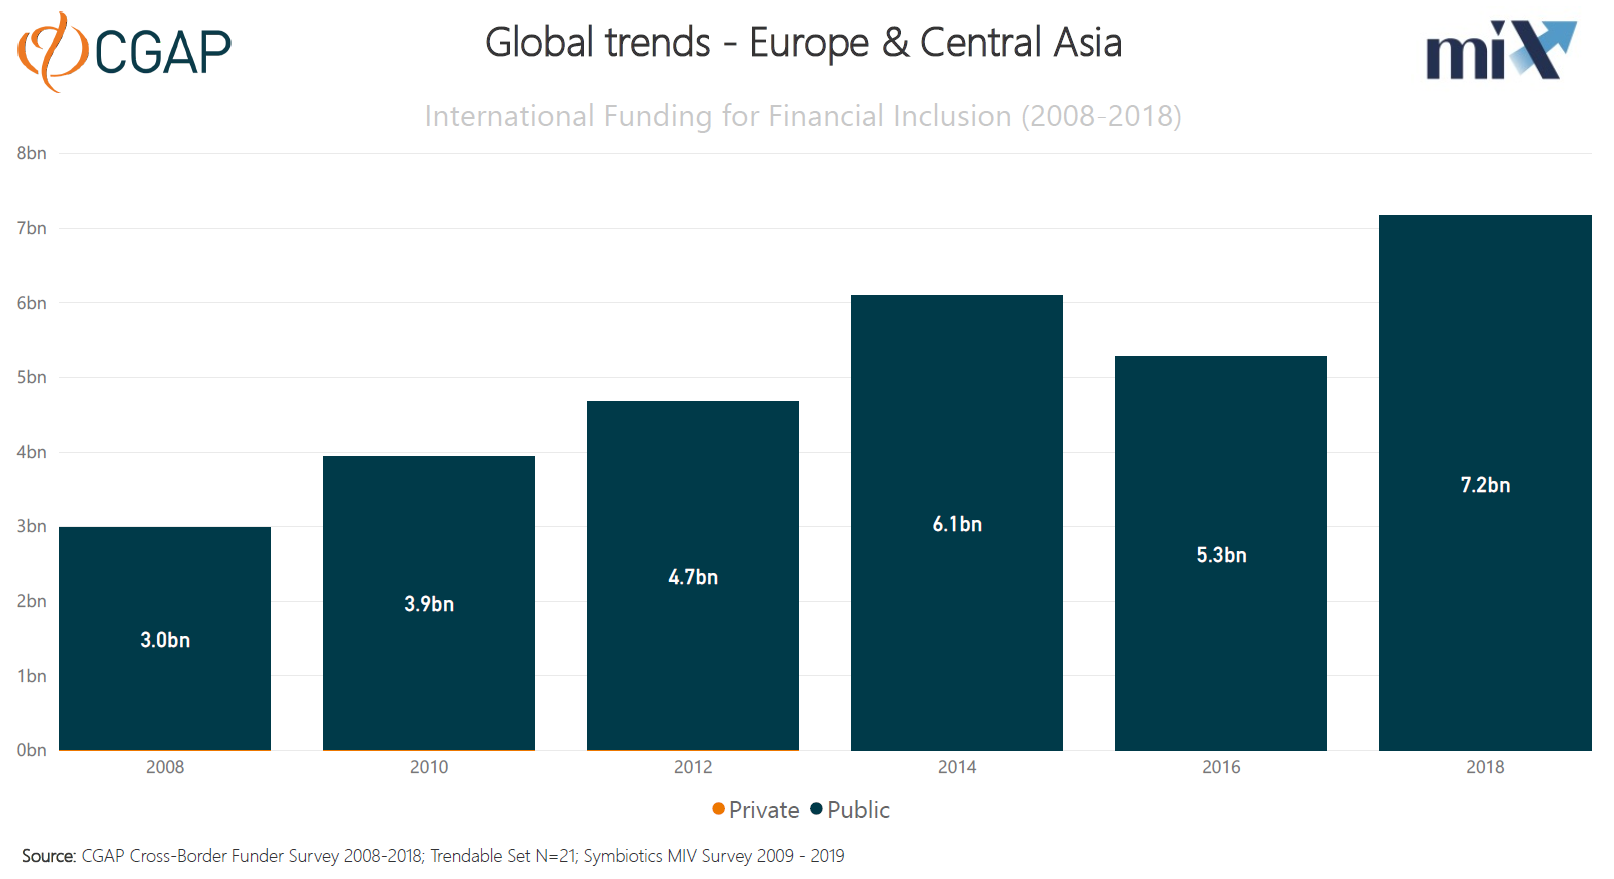
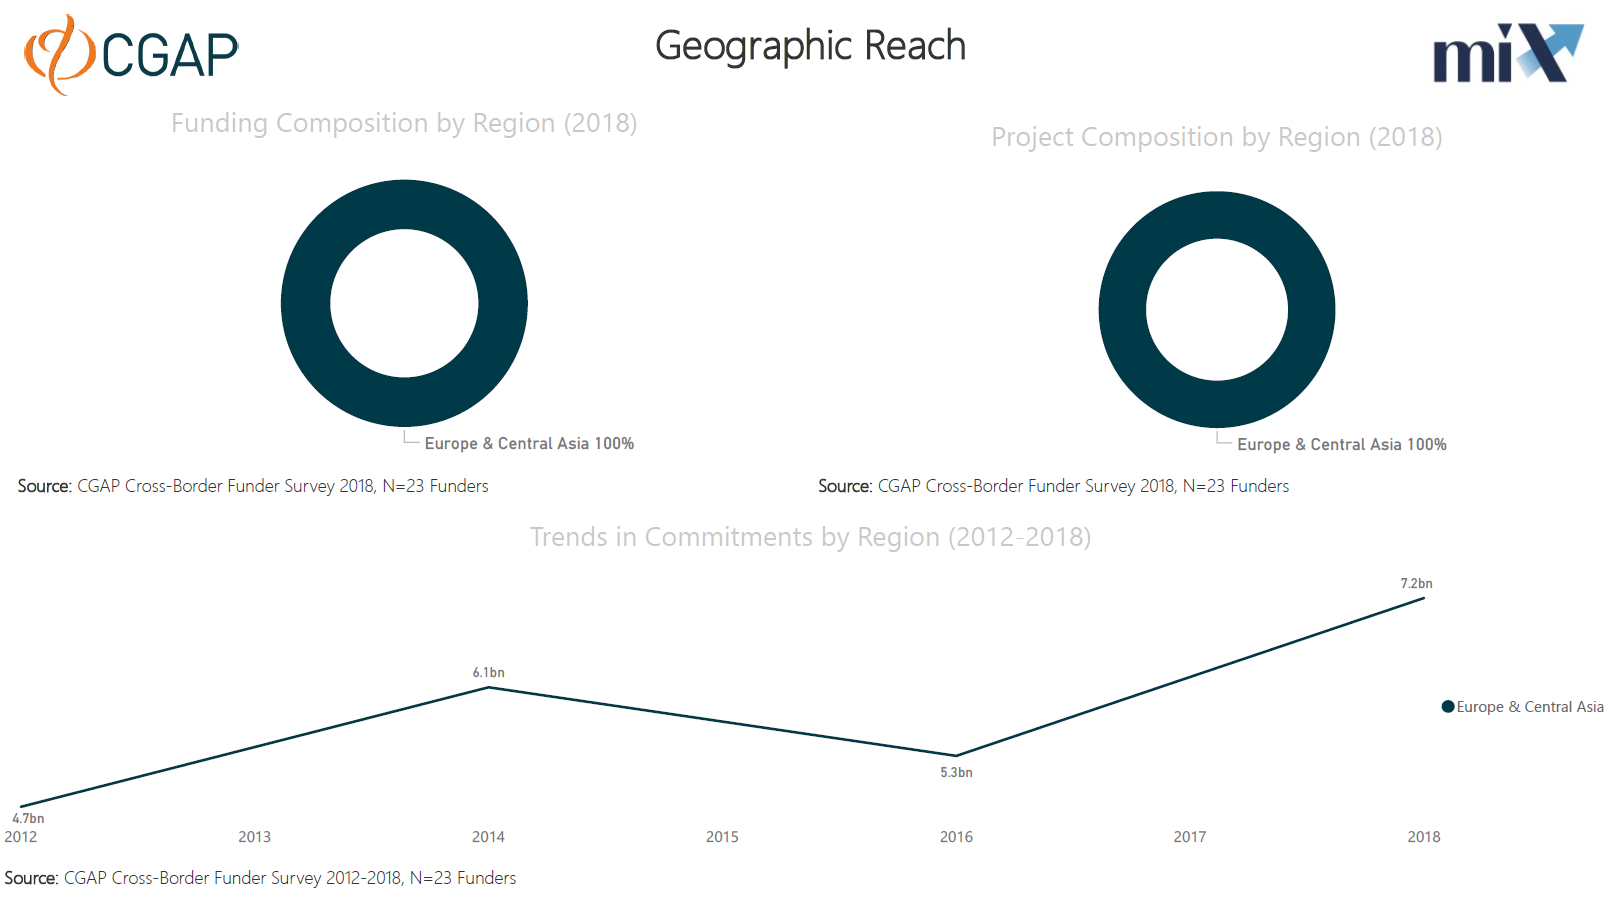
1. How much international funding is going to support financial inclusion in Europe and Central Asia?
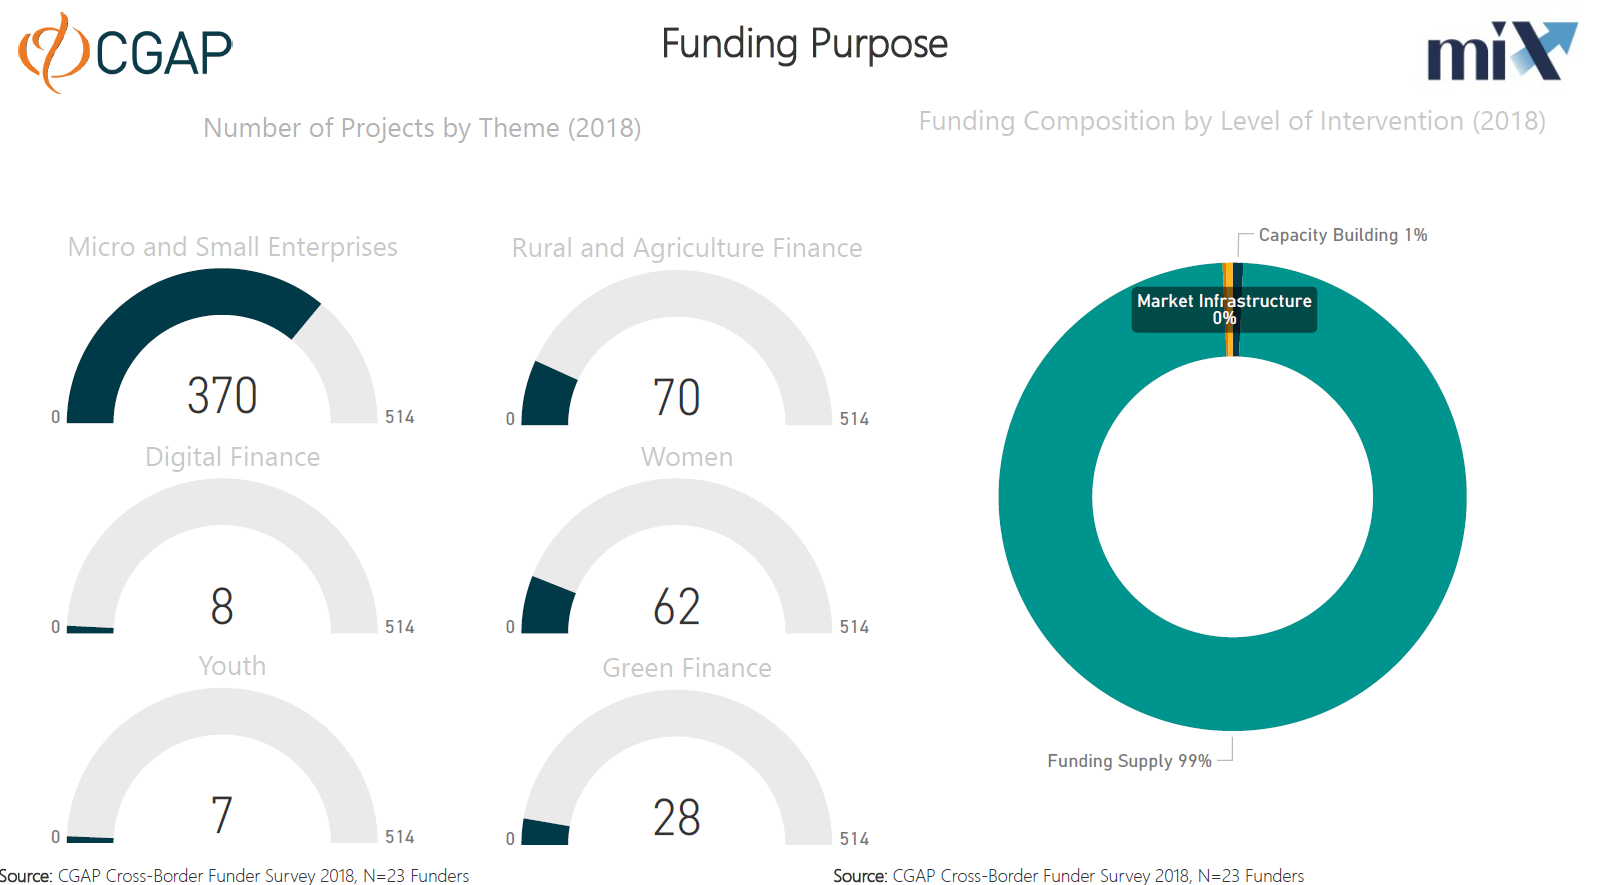
2. What do funders fund in Europe and Central Asia? (Themes, funding purpose)
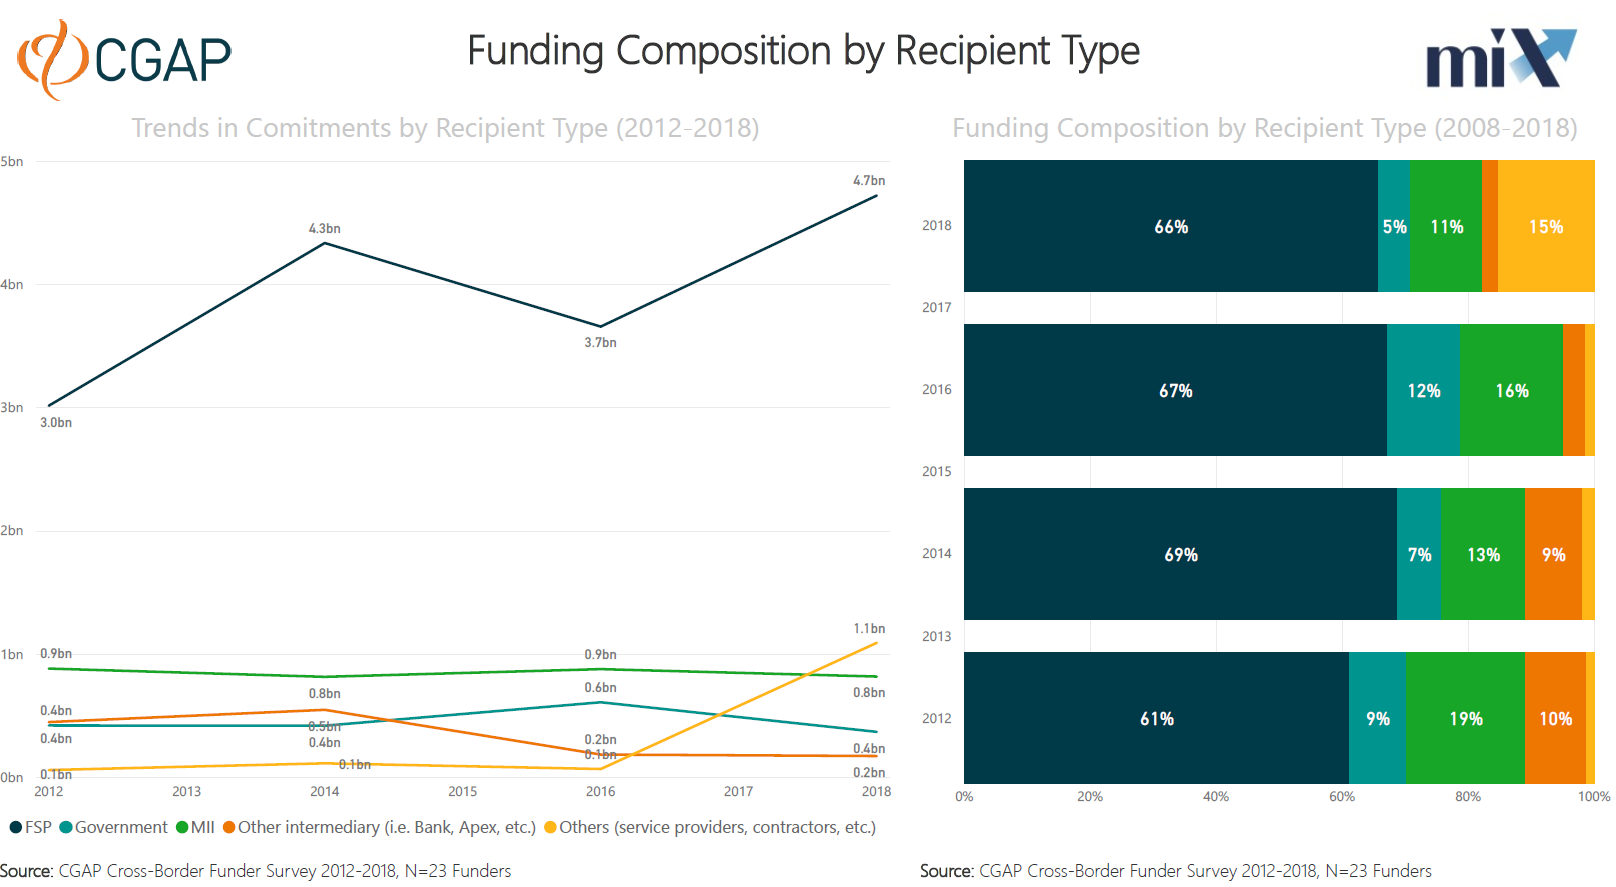
3. Who do funders fund in Europe and Central Asia? (Recipients)
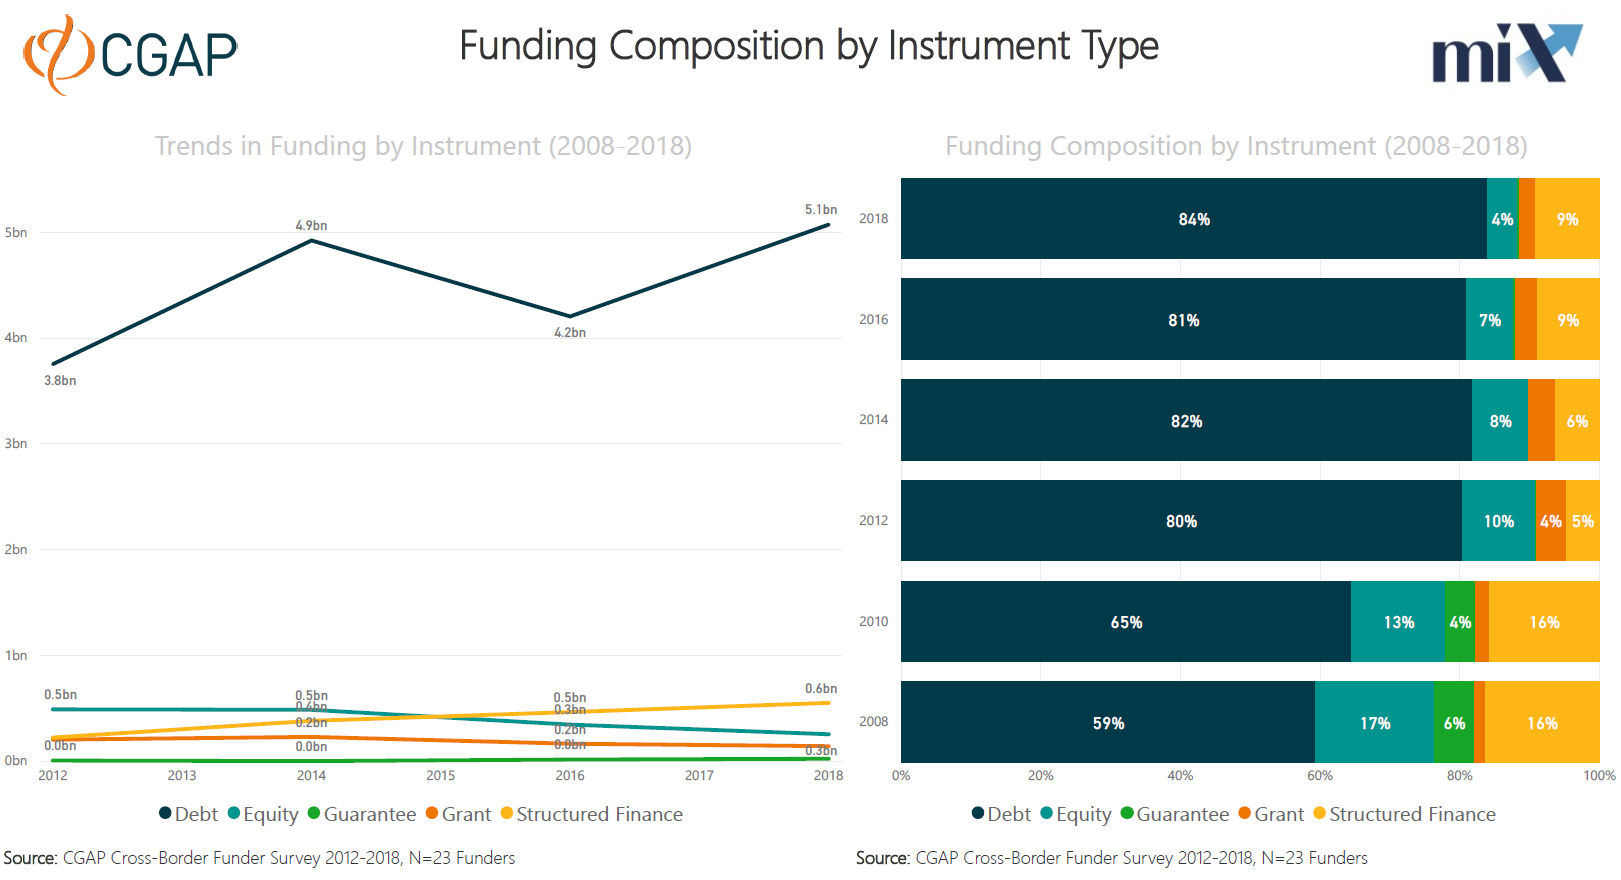
4. What is the funding composition by instrument type in Europe and Central Asia?
5. Where do they fund in Europe and Central Asia? (Geographic allocation of funding)
For more detailed information, use the Funding Explorer. This is a highly interactive analytical dashboard that uses data from the CGAP Funder Survey complemented by publicly available contextual indicators. Users can create specific queries from the recent reported data from the largest 23 international funders on their active funding commitments for financial inclusion as of December 31, 2018.
Related Resources
International funding increased by 12 percent in 2018 to approximately US$47 billion, a trend that has been consistent over the past five years. A third of international funders have been purposefully aligning their financial inclusion efforts to the achievement of SDGs.