In a Post-Pandemic World, How Healthy Are MFIs?
When the COVID-19 pandemic hit in 2020, it generated a sharp and very justifiable concern about the impact the associated slowdown of economic activity would have on smaller microfinance providers in low and middle-income countries — particularly on their most economically insecure customers. With the pandemic still casting long shadows, which have since darkened following rising global interest rates and geopolitical turbulence unfolding across the globe, the health of financial institutions is more critical than ever — the sustainability of serving the financially excluded depends on it.
To better understand the financial robustness of microfinance institutions (MFIs) in a post-pandemic world, CGAP has been working closely with MFR to track the finances of institutions after the pandemic using anonymized data from MFR’s ATLAS database, which houses data from more than 570 financial institutions as of 2022 (the last year of analysis).
Our analysis shows that parts of the microfinance sector remain vulnerable. Higher interest rates are affecting both the institutions and their predominantly low-income clients, and the repayment problems experienced during the pandemic, while improving, are still a cause for concern. Details of portfolio quality can be found in the associated detailed report. The analysis suggests that there seems to be a cluster of institutions still experiencing high credit risk, and unfortunately, the smallest institutions seem to be facing the biggest problems.
Portfolio size dynamics
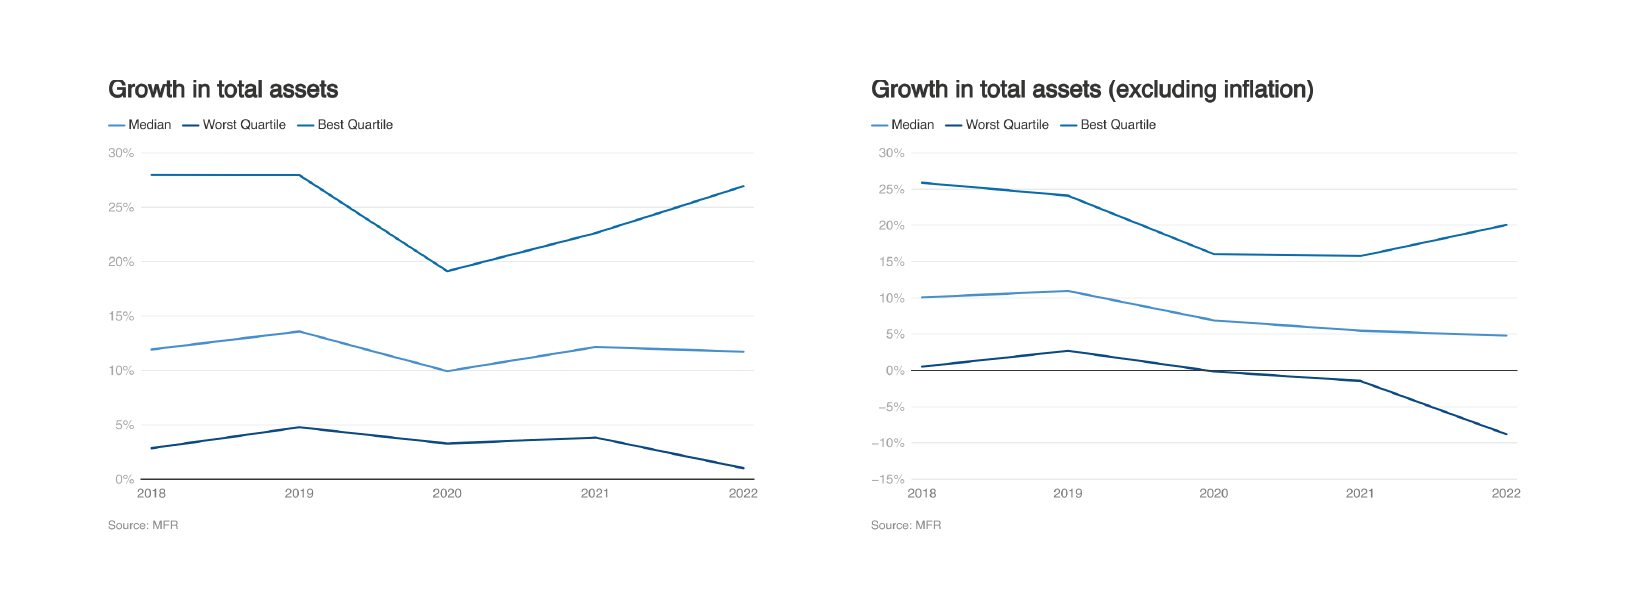
The financial performance analysis focused first and foremost on the growth in total MFI assets. There has been a recovery since 2020 in the institutions in the best-performing quartile (even after stripping out the effects of inflation), but the figures are still not back to pre-COVID levels. Of much greater concern, however, is that in real terms (i.e., when the impact of inflation is removed) the growth in total assets of the majority of MFIs slowed down for three consecutive years, and the total assets of the worst 25% of MFIs contracted in both 2021 and 2022. What this does is further widen the difference between the institutions performing the best and those performing the worst, an issue we see in the data elsewhere as well.
In addition to the global quartile analysis, we took a deeper dive into the number of financial institutions each year that experienced either growth or a decline in portfolio size. The findings indicate a consistent rise over time in the proportion of financial institutions experiencing negative growth, regardless of inflation adjustments. We need to bear in mind that the negative/positive notifier used is a simple binary classification and does not cover the extent of positive or negative movement but all the same, the results are sobering. When we adjust for inflation, the share of financial institutions with negative growth (i.e., those that have contracting total assets in real terms) is very high at 45.8%.
Portfolio size is fundamental to lenders’ business models as it is the primary revenue driver. If a portfolio keeps shrinking, the business risks not generating enough revenue to cover its fixed costs, much less to invest in expansion or better services. Left unchecked, this cycle can lead to the collapse (or acquisition or asset sale) of the MFI, potentially disrupting its customers’ access to finance.
Assessing solvency risk
Longer-term sustainability of the sector also requires solid portfolio quality in addition to size, so the analysis looked at this as well, focusing on solvency risk. It categorized the institutions in the sample into small, medium, and large and ascribed different vulnerability thresholds to these size categories based on their equity-to-asset ratio levels. There are three categories of vulnerability shown in the graphic below – acceptable, risk, and high risk. The risk thresholds set in the matrix are more tolerant in the case of medium and large institutions which, all things being equal, are considered to have better risk management and governance than smaller institutions and can bear these lower ratios. In 2022, 68% of financial institutions were deemed to have an acceptable solvency risk situation. However, 32% were in one of the two risk zones. This situation actually worsened compared to the 2020 or 2019 results when the share of institutions displaying solvency risk was almost five percentage points lower.
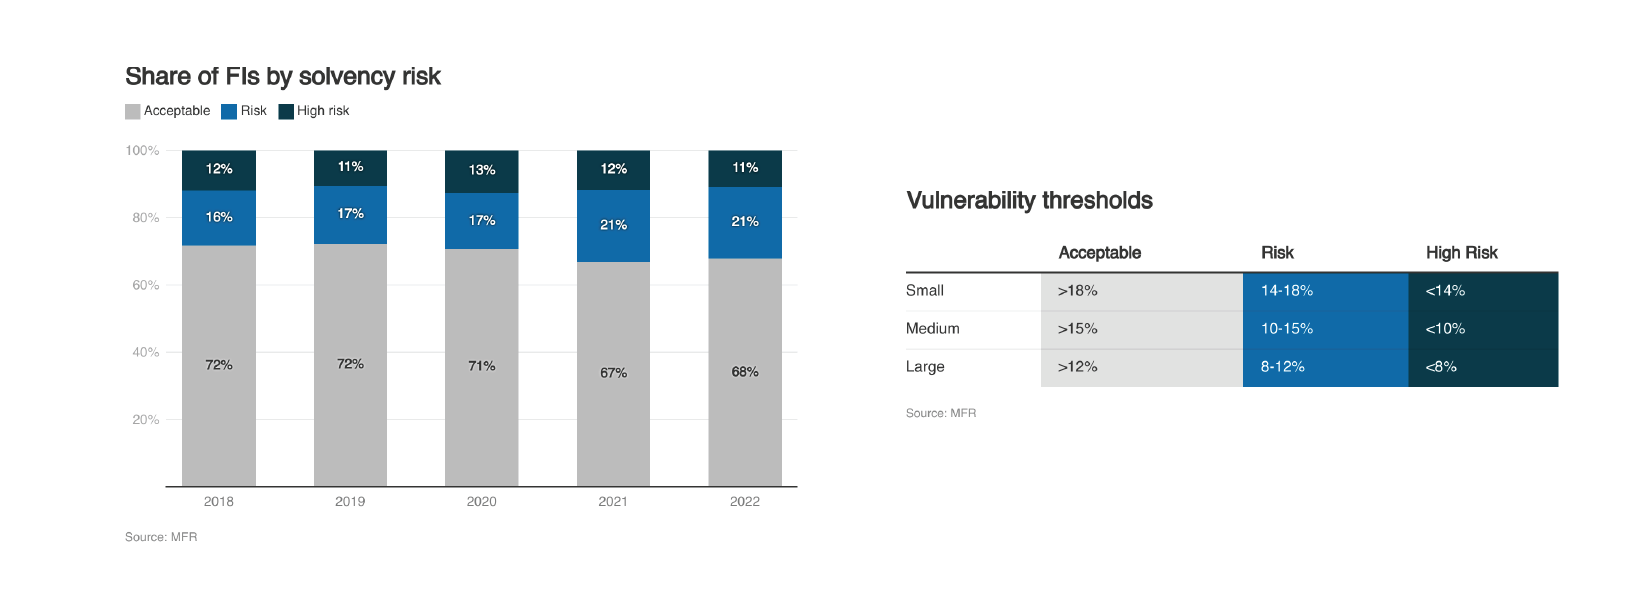
Within this riskier financial institution category, we found a disproportionate number of large and medium-sized institutions. This could be looked at from both a positive and a negative angle. On the one hand, large and medium-sized institutions are probably the ones that are more likely to have a deliberate strategy of optimizing their financial structure, so it may simply be their appetite for risk that results in low levels of equity to assets. They also tend to be able to access equity more easily compared to small institutions. On the other hand, in some cases, this could be a sign of financial stress (MFIs with higher credit risk also display higher solvency risk than the average), and financial stress in a large financial institution puts a great deal of financial inclusion outreach at risk. We will examine this in more detail as new data becomes available, as it has important ramifications for the sector. The breakdown of solvency risk by region is also noteworthy (see graph below).
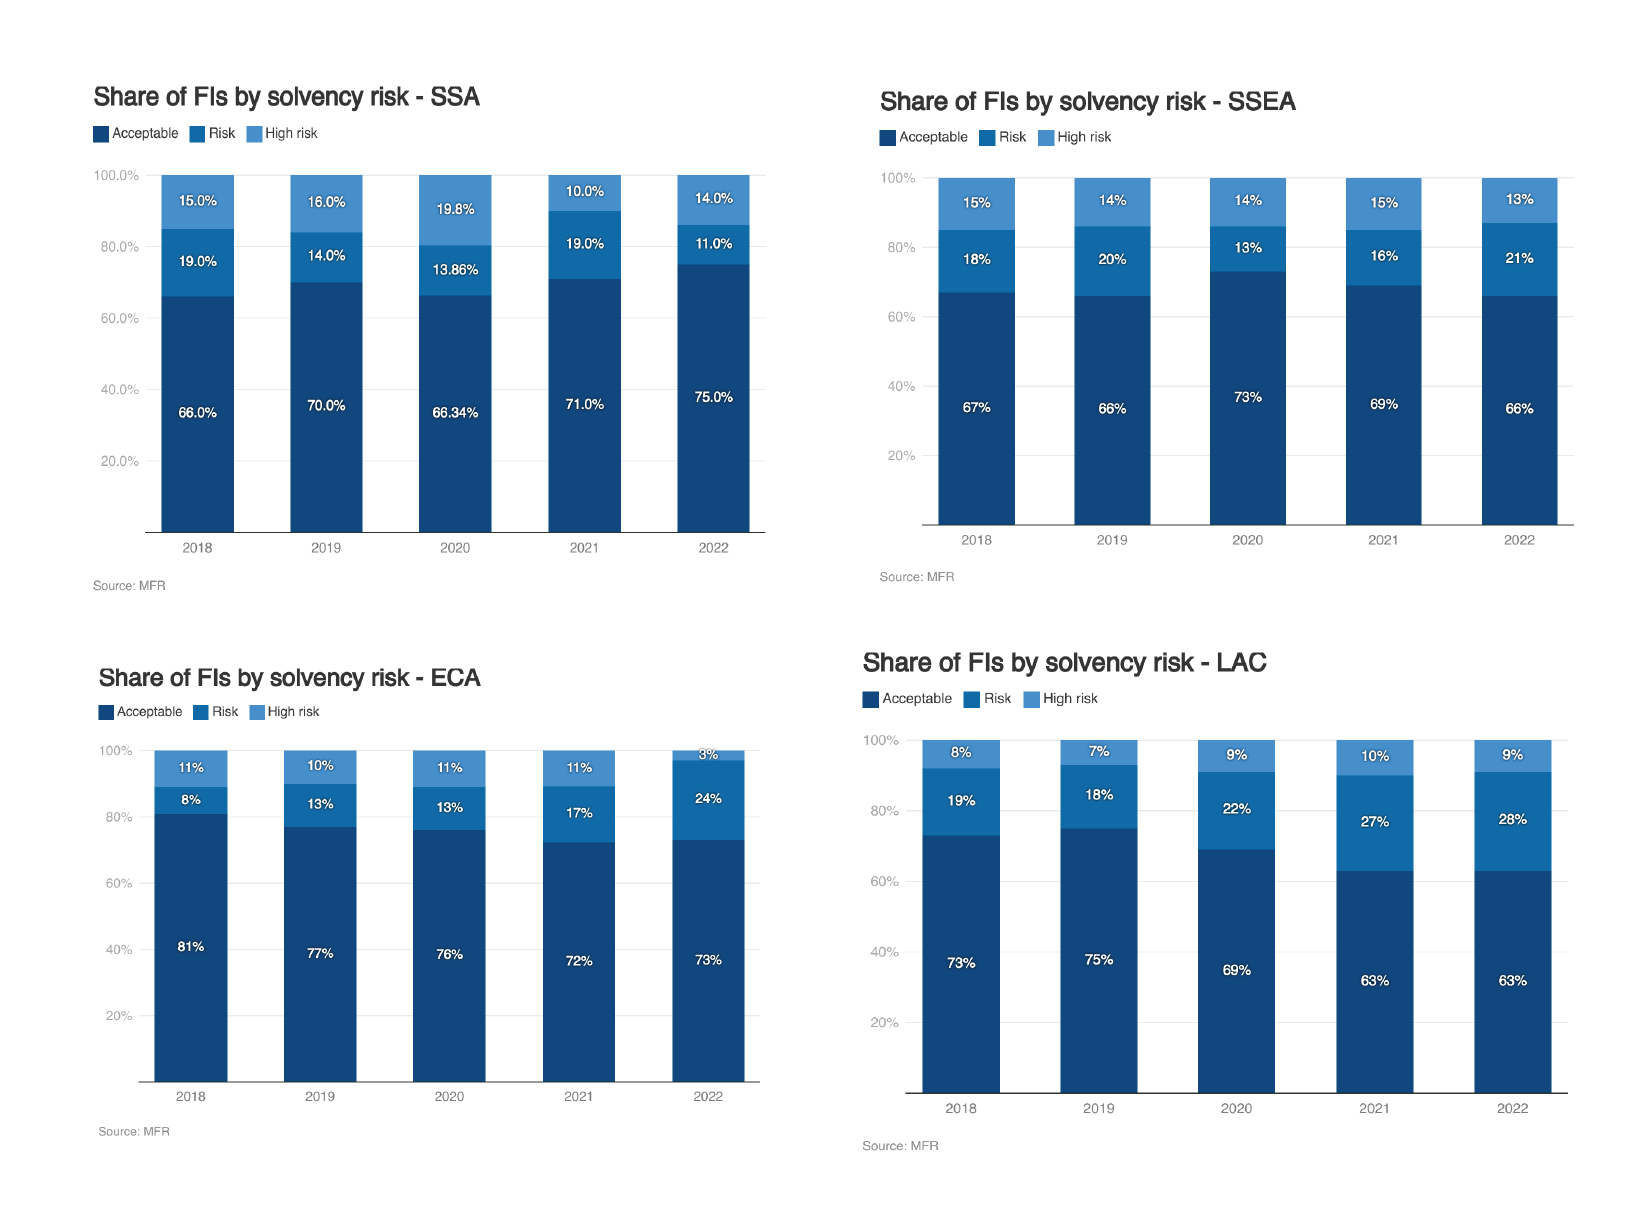
The two regions that experienced the highest solvency risk over the period analyzed appear to be Asia and Africa – in 2020, Africa hit almost 20% high risk, and Asia 15% in 2021. Although it is encouraging that from 2020 to 2021 returns in Africa improved and the high-risk category there dropped from 20% to 10%, this is one of the regions with the greatest need for financial services for low-income groups and the situation will benefit from careful monitoring in the short to medium term.
Conclusions
Stepping back to look at the broader picture this analysis has painted, it’s evident that overall MFI portfolio growth has slowed and become negative in real terms for an increasing share of the sector. This has hit smaller firms and those based in Africa the hardest. Since the sustainability of an MFI depends in large part on its scale, a decline in portfolio size threatens the viability of a significant proportion of the sector.
The COVID-19 pandemic was an unexpected, dramatic, outlier event and the industry has demonstrated some ability to restructure and recover, but concerns remain. If financial services (at reasonable rates) for lower-income people are to be maintained in the post-COVID era and throughout future shocks, then government, donor, and development finance institution support to help MFIs rebuild their portfolios will be essential, especially in areas where a sensible blending of commercial and concessional capital can be incorporated to address those that suffered particular damage.
At the same time, MFIs themselves will need to focus on digital innovations that can help reduce operating costs and build the platforms – and from there the scale – that can help counteract the effects of the pandemic on their portfolios. If left unaddressed, the resultant diminished lending capacity, constrained entrepreneurship, and increased recourse of their clients to informal sources of finance will inevitably lead to higher poverty levels and will further delay economic recovery.


Add new comment