The data snapshots generated here come from the 2018 CGAP Funder Survey (see publication and methodology), and they may be browsed online or downloaded for sharing and for use in your own presentations. Data snapshots are available at the global and regional levels. The 2018 CGAP Funder Survey reports funding commitments from 23 international funders, both public and private, as of the end of 2018.
Global Data Snapshot
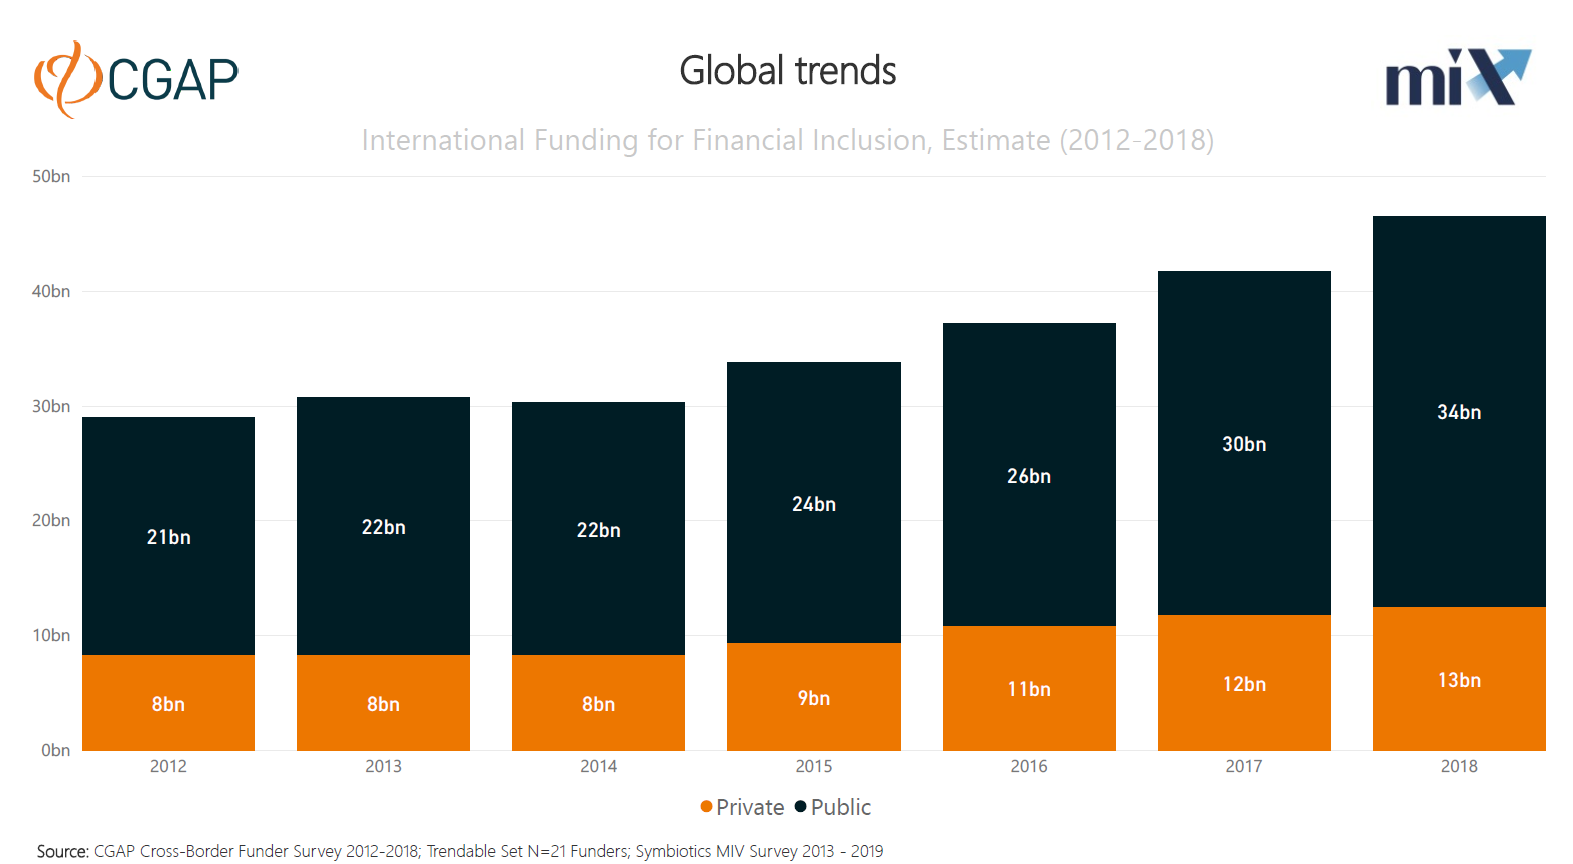
- How much international funding is going to support financial inclusion?
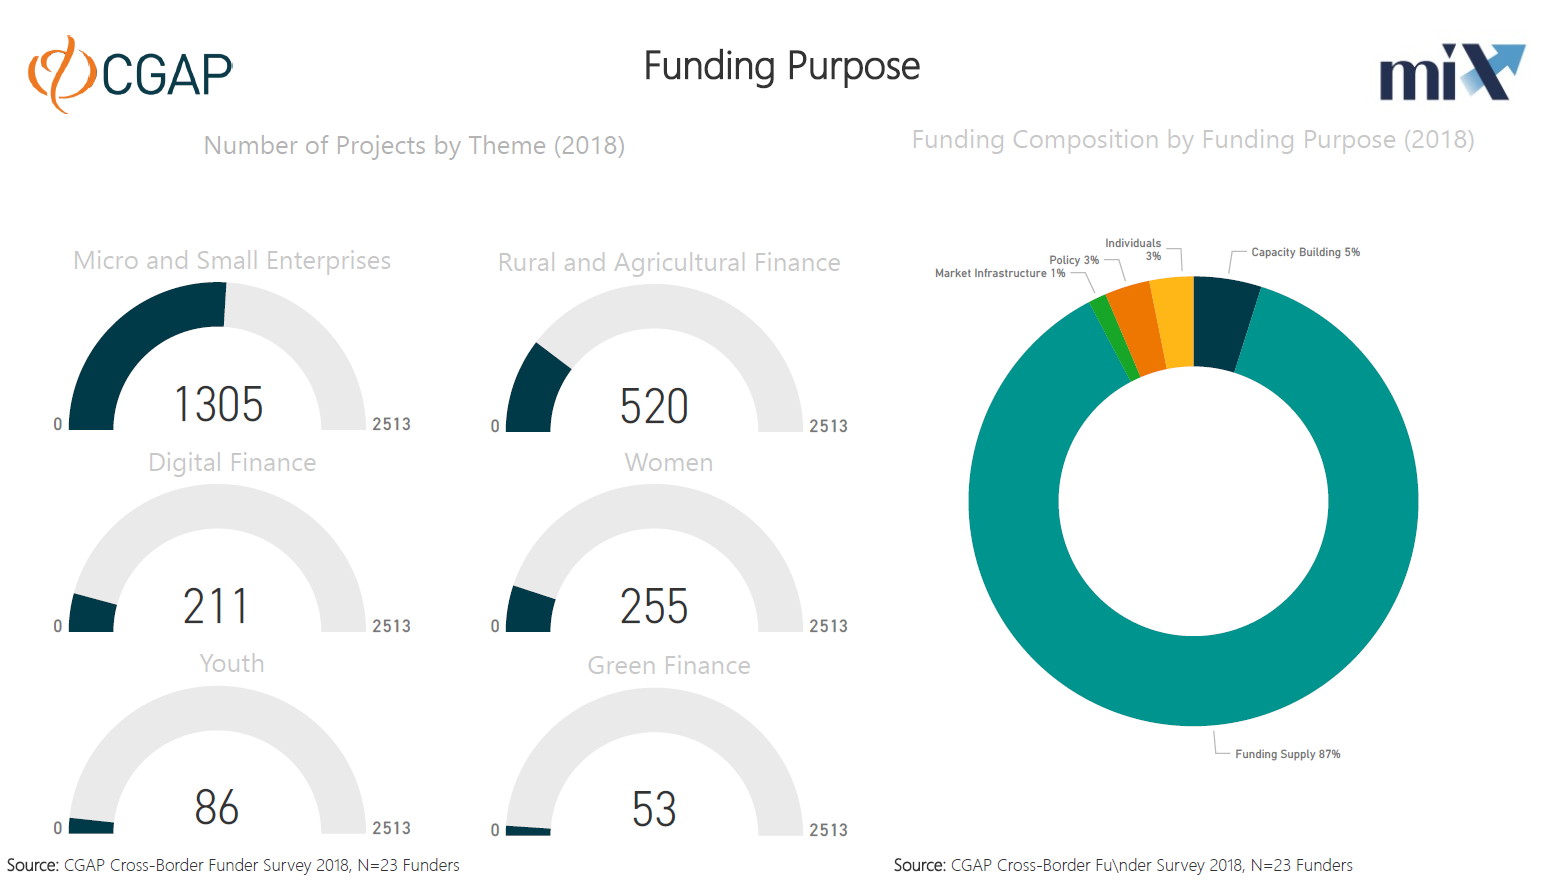
- What do funders fund? (Themes, funding purpose)
- Who do funders fund? (Recipients)
- How do they fund? (Funding instruments)
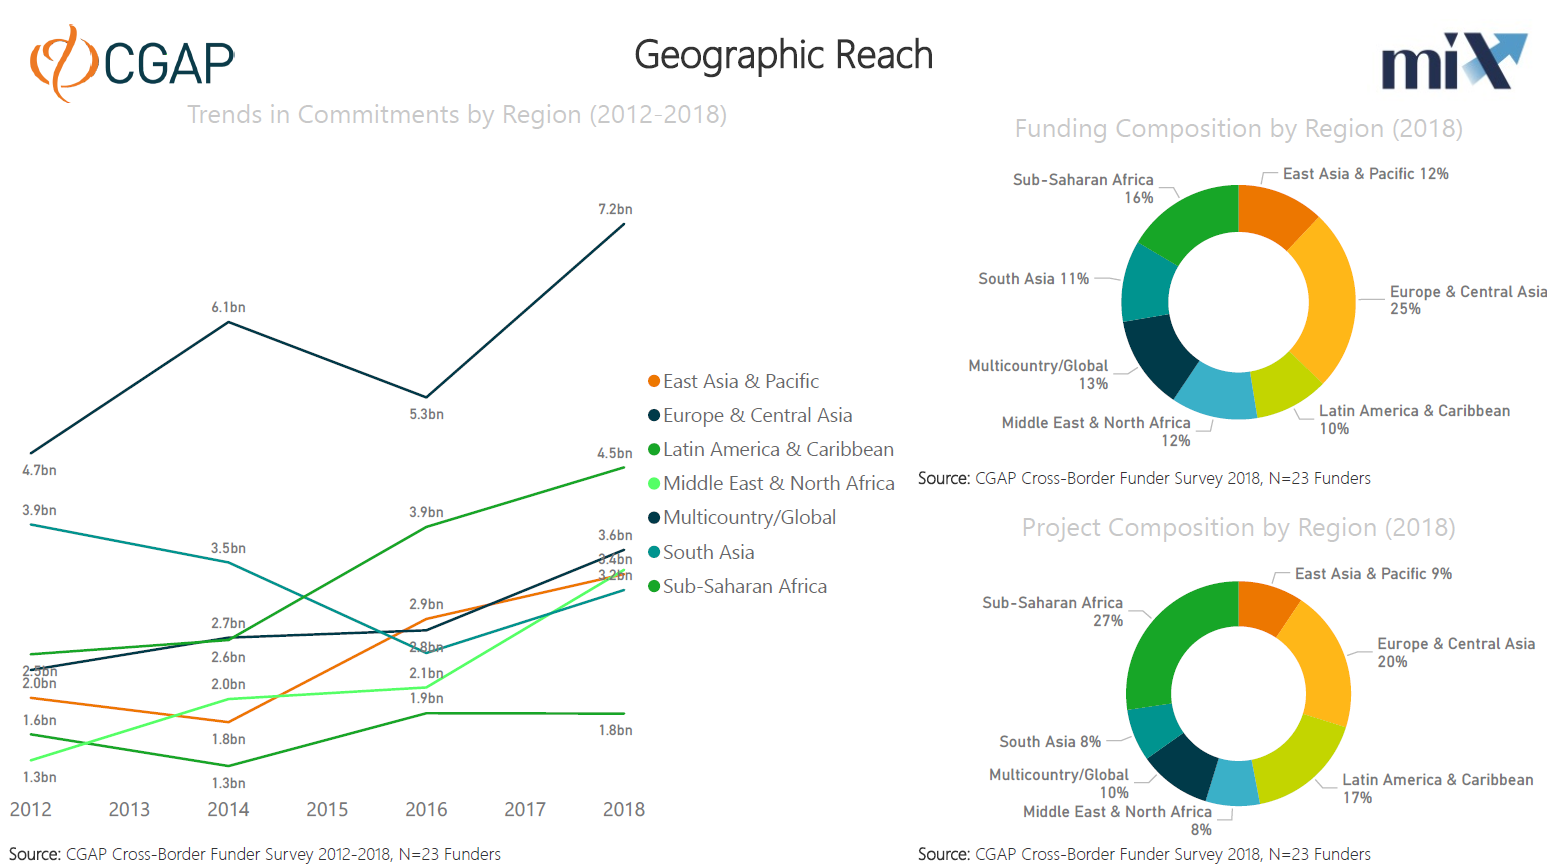
- Where do they fund? (Geographic allocation of funding)
Regions
- Europe and Central Asia
- East Asia and the Pacific
- South Asia
- Sub-Saharan Africa
- Latin America and the Caribbean
- Middle East and North Africa
For more detailed information, use the Funding Explorer. This is a highly interactive analytical dashboard that uses data from the CGAP Funder Survey complemented by publicly available contextual indicators. Users can create specific queries from the recent reported data from the largest 23 international funders on their active funding commitments for financial inclusion as of December 31, 2018.
1. How much international funding is going to support financial inclusion?
2. What do funders fund? (Themes, funding purpose)
3. Who do funders fund? (Recipients)

4. How do they fund? (Funding instruments)

5. Where do they fund? (Geographic allocation of funding)
Methodology
Who Do We Survey?
The CGAP Cross-Border Funder Survey, implemented in partnership with MIX, is conducted annually and alternates between surveying a full set of 54 and a subset of 23 of the largest funders worldwide. The subset of 23 funders accounts for 83 percent of the commitments from the survey’s full set of 54 funders and 60 percent of the global estimated commitments.
When the smaller set is surveyed, as was the case in 2018, the growth in total funding is estimated by adjusting the survey results for the full set of funders and total assets of MIVs, minus funding MIVs receive from international funders to avoid double counting. Thus the total funding for 2018 is a global estimate, which is compared with results from the larger survey conducted the prior year.
For this year’s survey of 2018 data, CGAP collected data from 23 international funders, both public and private. Public funders include development finance institutions and bilateral and multilateral development/aid agencies. Private funders include foundations, private donors and investors, and microfinance investment vehicles’ assets originating from high net worth individuals and other institutional investors.
What Is Surveyed?
The survey covers funding commitments at the end of each year for projects aimed at advancing financial inclusion either directly or indirectly, as part of broader development projects, including micro and small enterprises, digital finance, women, and youth (among many others). Funders are asked to report the commitments that are explicitly focused on financial inclusion, which is sometimes hard to establish. Therefore, the funding estimate should be considered the minimum level of commitments for this purpose.
How Are Calculations Performed?
The total funding estimate is calculated by combining data from the survey respondents and publicly available data from the Symbiotics MIV Survey (www.syminvest.com), removing double counting and adjusting for the full universe of international funders, where possible. For 2018 data, the volume of public funding commitments was adjusted by 3 p.p., and that of the private funding by 4 p.p.
Multi-year trends are based on the data of 42 funders who have reported bi-annually since 2009. For more information, download the survey methodology.